Feb 19, 2012

Keep the column/row headers visible on scroll through a report in SSRS 2008

SQL Server Reporting Services 2008 has a bug concerning the FixedColumnHeaders property of a tablix.
The property's description is given as :
"Indicates whether the column headers remain displayed on the page when the user scrolls the tablix data region off the page."
Well that's not actually true because setting that property to, well, anything has no discernible effect. Microsoft have acknowledge the bug (without actually calling it a bug) and provided a workaround in a knowledge base article:


Cause:
This problem occurs because the properties to enable the fixed headers feature have changed from SQL Server 2005 to SQL Server 2008. The structure of tables and matrices is replaced by a Tablix.

WorkAround:
To work around this issue, use one of the following two methods:
Method 1: Keep the original structure of the current data region
  1. On the Report menu, click Grouping.
  2. In the Grouping pane, click the selector arrow in the upper-right corner, and then click Advanced.
  3. Select a Tablix member in the Row Groups or Column Groups pane that corresponds to a row or a column that you want to fix.
  4. In the Properties dialog box, set the FixedData property to True.
Note You can set the FixedData property to True only if there is no corresponding Tablix row header area or column header area in the data region.
Method 2: Add a row group or a column group to the Tablix
  1. To obtain the row or column grouping area in the Tablix, add a row group or a column group.
  2. After you add a row group or a column group, you can change the content in those areas as necessary. This reflects the content that you want to fix when you scroll.
Note When you create new tables in SQL Server 2008, add a row grouping area or a column grouping area to the table by adding row or column groups to the data region. Then, replace the content.

 ******
In a Tablix, there are explicit row header and column header areas of the data region that are defined by a double-dashed line. This line is visible on the design surface.

Tables that you upgrade from SQL Server 2005 do not generate a Tablix row header area or column header area. After you upgrade from SQL Server 2005, you may click to select the Header should remain visible while scrolling check box in the Tablix dialog box. This step does not generate fixed column headers or fixed row headers.

Assume that you define fixed headers in a table or in a matrix in SQL Server 2005, and then you upgrade to SQL Server 2008. The fixed header settings are translated to the new FixedData setting. This feature works correctly. If you do not enable this feature in SQL Server 2005, and you try to set it or change it by setting theFixedHeader property in SQL Server 2008, this feature does not work. 

When you create new tables in SQL Server 2008, the default table placeholder does not have a Tablix row header or column header area. Therefore, setting the FixedHeader property does not perform as usual.

Microsoft intends to improve the user interfaces for this feature in the next version of SQL Server Report Builder and Report Designer.

Feb 16, 2012

Using Loops in VBA in Microsoft Excel

Download Sample Excel file

Why Loops?

The purpose of a loop is to get Excel to repeat a piece of code a certain number of times. How many times the code gets repeated can be specified as a fixed number (e.g. do this 10 times), or as a variable (e.g. do this for as many times as there are rows of data).
Loops can be constructed many different ways to suit different circumstances. Often the same result can be obtained in different ways to suit your personal preferences. These exercises demonstrate a selection of different ways to use loops.
There are two basic kinds of loops, both of which are demonstrated here: Do…Loop and For…Next loops. The code to be repeated is placed between the key words.
Open the workbook VBA02-Loops.xls and take a look at the four worksheets. Each contains two columns of numbers (columns A and B). The requirement is to calculate an average for the numbers in each row using a VBA macro.
Now open the Visual Basic Editor (Alt+F11) and take a look at the code in Module1.  You will see a number of different macros. In the following exercises, first run the macro then come and read the code and figure out how it did what it did.
You can run the macros either from the Visual Basic Editor by placing your cursor in the macro and pressing the F5 key, or from Excel by opening the Macros dialog box (ALT+F8) choosing the macro to run and clicking Run. It is best to run these macros from Excel so you can watch them as they work.

Exercise 1: Do… Loop Until…

The object of this macro is to run down column C as far as is necessary putting a calculation in each cell as far as is necessary.
On Sheet1 select cell C2 and run the macro Loop1.
Here's the code:
Sub Loop1()
' This loop runs until there is nothing in the next column
    Do
    ActiveCell.FormulaR1C1 = "=Average(RC[-1],RC[-2])"
    ActiveCell.Offset(1, 0).Select
    Loop Until IsEmpty(ActiveCell.Offset(0, 1))
End Sub
This macro places a formula into the active cell, and moves into the next cell down. It uses Loop Until to tell Excel to keep repeating the code until the cell in the adjacent column (column D) is empty. In other words, it will keep on repeating as long as there is something in column D.
Delete the data from cells C2:C20 and ready for the next exercise

Exercise 2: Do While… Loop

The object of this macro is to run down column C as far as is necessary putting a calculation in each cell as far as is necessary.
On Sheet1 select cell C2 and run the macro Loop2
Here's the code
Sub Loop2()
' This loop runs as long as there is something in the next column
    Do While IsEmpty(ActiveCell.Offset(0, 1)) = False
    ActiveCell.FormulaR1C1 = "=Average(RC[-1],RC[-2])"
    ActiveCell.Offset(1, 0).Select
    Loop
End Sub
This macro does the same job as the last one using the same parameters but simply expressing them in a different way. Instead of repeating the code Until something occurs, it does something While something is the case. It uses Do While to tell Excel to keep repeating the code while there is something in the adjacent column as opposed to until there is nothing there. The function IsEmpty = False means "Is Not Empty".
Delete the data from cells C2:C20 and ready for the next exercise

Exercise 3: Do While Not… Loop

The object of this macro is to run down column C as far as is necessary putting a calculation in each cell as far as is necessary.
On Sheet1 select cell C2 and run the macro Loop3.
Here's the code:
Sub Loop3()
' This loop runs as long as there is something in the next column
    Do While Not IsEmpty(ActiveCell.Offset(0, 1))
    ActiveCell.FormulaR1C1 = "=Average(RC[-1],RC[-2])"
    ActiveCell.Offset(1, 0).Select
    Loop
End Sub
This macro makes exactly the same decision as the last one but just expresses it in a different way. IsEmpty = False means the same as Not IsEmpty. Sometimes you can't say what you want to say one way so VBA often offers an alternative syntax.
Delete the data from cells C2:C20 and ready for the next exercise

Exercise 4: Including an IF statement

The object of this macro is as before, but without replacing any data that may already be there.
Move to Sheet2, select cell C2 and run the macro Loop4.
Here's the code:
Sub Loop4()
' This loop runs as long as there is something in the next column
' It does not calculate an average if there is already something in the cell
    Do
    If IsEmpty(ActiveCell) Then
        ActiveCell.FormulaR1C1 = "=Average(RC[-1],RC[-2])"
    End If
    ActiveCell.Offset(1, 0).Select
    Loop Until IsEmpty(ActiveCell.Offset(0, 1))
End Sub
The previous macros take no account of any possible contents that might already be in the cells into which it is placing the calculations. This macro uses an IF statement that tells Excel to write the calculation only if the cell is empty. This prevents any existing data from being overwritten. The line telling Excel to move to the next cell is outside the IF statement because it has to do that anyway.

Exercise 5: Avoiding Errors

This macro takes the IF statement a stage further, and doesn't try to calculate an average of cells that are empty.
First, look at the problem. Move to Sheet3, select cell C2 and run the macro Loop4.
Note that because some of the pairs of cells in columns A and B are empty, the =AVERAGE function throws up a #DIV/0 error (the Average function adds the numbers in the cells then divides by the number of numbers - if there aren't any numbers it tries to divide by zero and you can't do that!).
Delete the contents of cells C2:C6 and C12:C20. Select cell C2 and run the macro Loop5.
Here's the code:
Sub Loop5()
' This loop runs as long as there is something in the next column
' It does not calculate an average if there is already something in the cell
' nor if there is no data to average (to avoid #DIV/0 errors).
    Do
    If IsEmpty(ActiveCell) Then
        If IsEmpty(ActiveCell.Offset(0, -1)) And IsEmpty(ActiveCell.Offset(0, -2)) Then
            ActiveCell.Value = ""
        Else
            ActiveCell.FormulaR1C1 = "=Average(RC[-1],RC[-2])"
        End If
    End If
    ActiveCell.Offset(1, 0).Select
    Loop Until IsEmpty(ActiveCell.Offset(0, 1))
End Sub
Note that this time there are no error messages because Excel hasn't tried to calculate averages of numbers that aren't there.
In this macro there is a second IF statement inside the one that tells Excel to do something only if the cell is empty. This second IF statement gives excel a choice. Instead of a simple If there is an If and an Else. Here's how Excel reads its instructions…
"If the cell has already got something in, go to the next cell. But if the cell is empty, look at the corresponding cells in columns A an B and if they are both empty, write nothing (""). Otherwise, write the formula in the cell. Then move on to the next cell."

Exercise 6: For… Next Loop

If you know, or can get VBE to find out, how many times to repeat a block of code you can use a For… Next loop.
Move to Sheet4, select cell C2 and run the macro Loop6.
Here's the code:
Sub Loop6()
' This loop repeats for a fixed number of times determined by the number of rows
' in the range
    Dim i AsInteger
    For i = 1 To Selection.CurrentRegion.Rows.Count - 1
    ActiveCell.FormulaR1C1 = "=Average(RC[-1],RC[-2])"
    ActiveCell.Offset(1, 0).Select
    Next i
End Sub
This macro doesn't make use of an adjacent column of cells like the previous ones have done to know when to stop looping. Instead it counts the number of rows in the current range of data and uses the For… Next method to tell Excel to loop that number of times (minus one, because when VBA counts it starts at zero).

Exercise 7: Getting the Reference From Somewhere Else

Select cell G2 and run the macro Loop7.
Here's the code:
Sub Loop7()
' This loop repeats a fixed number of times getting its reference from elsewhere
    Dim i As Integer
    Dim intRowCount As Integer
    intRowCount = Range("A1").CurrentRegion.Rows.Count - 1
    For i = 1 To intRowCount
    ActiveCell.FormulaR1C1 = "=Average(RC[-5],RC[-6])"
    ActiveCell.Offset(1, 0).Select
    Next i
End Sub
You can get the reference for the number of loops from anywhere. This macro places a set of calculations in column G for a number of times dictated by the number of rows in the block of data starting with cell A1. The For… Next statement has been simplified a bit by first declaring a variable intRowCount and filling it with the appropriate information (how many rows in the block by A1). This variable gets used in the next line instead of a long line of code. This is just another example of doing the same job a different way.
If you wanted to construct a loop that always ran a block of code a fixed number of times, you could simply use an expression like:
            For i = 1 To 23

Exercise 8: About Doing Calculations…

All the previous exercises have placed a calculation into a worksheet cell by actually writing a regular Excel function into the cell (and leaving it there) just as if you had typed it yourself. The syntax for this is:
ActiveCell.FormulaR1C1 = “TYPE YOUR FUNCTION HERE”
These macros have been using:
ActiveCell.FormulaR1C1 = “=Average(RC[-5],RC[-6])”
Because this method actually places a function into the cell rather than a value, their results will change as the cells that they refer to change, just like regular functions – because they are regular functions. The calculating gets done in Excel because all that the macro did was to write the function.
If you prefer, you can get the macro to do the calculating and just write the result into the cell. VBA has its own set of functions, but unfortunately AVERAGE isn’t one of them. However, VBA does support many of the commoner Excel functions with its WorksheetFunction method.
On Sheet1 select cell C2 and run the macro Loop1.
Take a look at the cells you just filled in. Each one contains a function, written by the macro.
Now delete the contents from the cells C2:C20, select cell C2 and run the macro Loop8.
Here’s the code:
Sub Loop8()
    Do
    ActiveCell.Value = WorksheetFunction.Average(ActiveCell.Offset(0, -1).Value, _
         ActiveCell.Offset(0, -2).Value)
    ActiveCell.Offset(1, 0).Select
    Loop Until IsEmpty(ActiveCell.Offset(0, 1))
End Sub
Take a look at the cells you just filled in. This time there’s no function, just the value. All the calculating was done by the macro which then wrote the value into the cell.

Excel Formulas

Excel Formulas


Array Formulas

Many of the formulas described here are Array Formulas, which are a special type of formula
in Excel.  If you are not familiar with Array Formulas, click 
here.


Array To Column

Sometimes it is useful to convert an MxN array into a single column of data, for example for charting (a data series must be a single row or column).  Click 
here for more details.


Averaging Values In A Range
You can use Excel's built in =AVERAGE function to average a range of values.  By using it
with other functions, you can extend its functionality.

For the formulas given below, assume that our data is in the range A1:A60.
Averaging Values Between Two Numbers
Use the array formula
=AVERAGE(IF((A1:A60>=Low)*(A1:A60<=High),A1:A60))
Where Low and High are the values between which you want to average.
Averaging The Highest N Numbers In A Range
To average the N largest numbers in a range, use the array formula
=AVERAGE(LARGE(A1:A60,ROW(INDIRECT("1:10"))))
Change "1:10" to "1:N" where N is the number of values to average.
Averaging The Lowest N Numbers In A Range
To average the N smallest numbers in a range, use the array formula
=AVERAGE(SMALL(A1:A60,ROW(INDIRECT("1:10"))))
Change "1:10" to "1:N" where N is the number of values to average.
In all of the formulas above, you can use =SUM instead of =AVERAGE to sum, rather
than average, the numbers. 


Counting Values Between Two Numbers

If you need to count the values in a range that are between two numbers, for example between
5 and 10, use the following array formula:
=SUM((A1:A10>=5)*(A1:A10<=10))
To sum the same numbers, use the following array formula:
=SUM((A1:A10>=5)*(A1:A10<=10)*A1:A10)


Counting Characters In A String
The following formula will count the number of "B"s, both upper and lower case, in the string in B1.
=LEN(B1)-LEN(SUBSTITUTE(SUBSTITUTE(B1,"B",""),"b",""))

Date And Time Formulas
A variety of formulas useful when working with dates and times are described on
the DateTime page.
Other Date Related Procedures are described on the following pages.


Duplicate And Unique Values In A Range

The task of finding duplicate or unique values in a range of data requires some complicated
formulas.  These procedures are described in 
Duplicates.


Dynamic Ranges
You can define a name to refer to a range whose size varies depending on its contents.   For example, you may want a range name that refers only to the portion of a list of numbers that are not blank.  such as only the first N non-blank cells in A2:A20.   Define a name called MyRange, and set the Refers To property to:
=OFFSET(Sheet1!$A$2,0,0,COUNTA($A$2:$A$20),1)
Be sure to use absolute cell references in the formula.  Also see then Named Ranges page for more information about dynamic ranges.


Finding The Used Part Of A Range

Suppose we've got a range of data called DataRange2, defined as H7:I25, and that
cells H7:I17 actually contain values. The rest are blank. We can find various properties
of the range, as follows:
To find the range that contains data, use the following array formula:

=ADDRESS(ROW(DataRange2),COLUMN(DataRange2),4)&":"&
ADDRESS(MAX((DataRange2<>"")*ROW(DataRange2)),COLUMN(DataRange2)+
COLUMNS(DataRange2)-1,4)

This will return the range H7:I17.  If you need the worksheet name in the returned range,
use the following array formula:
=ADDRESS(ROW(DataRange2),COLUMN(DataRange2),4,,"MySheet")&":"&
ADDRESS(MAX((DataRange2<>"")*ROW(DataRange2)),COLUMN(DataRange2)+
COLUMNS(DataRange2)-1,4)

This will return MySheet!H7:I17.
To find the number of rows that contain data, use the following array formula:

=(MAX((DataRange2<>"")*ROW(DataRange2)))-ROW(DataRange2)+1
This will return the number 11, indicating that the first 11 rows of DataRange2 contain data.
To find the last entry in the first column of DataRange2, use the following array formula:

=INDIRECT(ADDRESS(MAX((DataRange2<>"")*ROW(DataRange2)),
COLUMN(DataRange2),4))
To find the last entry in the second column of DataRange2, use the following array formula:
=INDIRECT(ADDRESS(MAX((DataRange2<>"")*ROW(DataRange2)),
COLUMN(DataRange2)+1,4))

First And Last Names
Suppose you've got a range of data consisting of people's first and last names.
There are several formulas that will break the names apart into first and last names
separately.

Suppose cell A2 contains the name "John A Smith".

We can extend these ideas to the following.  Suppose A1 contains the
string  "First   Second  Third Last".
Returning  First Word In A String=LEFT(A1,FIND(" ",A1,1))
This will return the word "First".
Returning Last Word In A String=RIGHT(A1,LEN(A1)-MAX(ROW(INDIRECT("1:"&LEN(A1))) *(MID(A1,ROW(INDIRECT("1:"&LEN(A1))),1)=" ")))
This formula in as array formula.
(This formula comes from Laurent Longre). This will return the word "Last"
Returning All But First Word In A String=RIGHT(A1,LEN(A1)-FIND(" ",A1,1))This will return the words  "Second  Third Last"
Returning Any Word Or Words In A String
The following two array formulas come compliments of Laurent Longre. To return any single word from a single-spaced string of words, use the following array formula:
=MID(A10,SMALL(IF(MID(" "&A10,ROW(INDIRECT
("1:"&LEN(A10)+1)),1)=" ",ROW(INDIRECT("1:"&LEN(A10)+1))),
B10),SUM(SMALL(IF(MID(" "&A10&" ",ROW(INDIRECT
("1:"&LEN(A10)+2)),1)=" ",ROW(INDIRECT("1:"&LEN(A10)+2))),
B10+{0,1})*{-1,1})-1)

Where A10 is the cell containing the text, and B10 is the number of the word you want to get.
This formula can be extended to get any set of words in the string.  To get the words from M for N words (e.g., the 5th word for 3, or the 5th, 6th, and 7th words), use the following array formula:
=MID(A10,SMALL(IF(MID(" "&A10,ROW(INDIRECT
("1:"&LEN(A10)+1)),1)=" ",ROW(INDIRECT("1:"&LEN(A10)+1))),
B10),SUM(SMALL(IF(MID(" "&A10&" ",ROW(INDIRECT
("1:"&LEN(A10)+2)),1)=" ",ROW(INDIRECT("1:"&LEN(A10)+2))),
B10+C10*{0,1})*{-1,1})-1)

Where A10 is the cell containg the text, B10 is the number of the word to get, and C10 is the number of words, starting at B10, to get.
Note that in the above array formulas, the {0,1} and {-1,1} are enclosed in array braces (curly brackets {} ) not parentheses.
Download a workbook illustrating these formulas.


Grades

A frequent question is how to assign a letter grade to a numeric value.  This is simple.  First create a define name called "Grades" which refers to the array:

={0,"F";60,"D";70,"C";80,"B";90,"A"}


Then, use VLOOKUP to convert the number to the grade:
=VLOOKUP(A1,Grades,2)


where A1 is the cell contains the numeric value.  You can add entries to the Grades array for other grades like C- and C+.  Just make sure the numeric values in the array are in increasing order.


High And Low Values

You can use Excel's Circular Reference tool to have a cell that contains the highest ever reached value.  For example, suppose you have a worksheet used to track team scores.    You can set up a cell that will contain the highest score ever reached, even if that score is deleted from the list.  Suppose the score are in A1:A10.  First, go to the Tools->Options dialog, click on the Calculation tab, and check the Interations check box.  Then, enter the following formula in cell B1:

=MAX(A1:A10,B1)


Cell B1 will contian the highest value that has ever been present in A1:A10, even if that value is deleted from the range.  Use the =MIN function to get the lowest ever value.
Another method to do this, without using circular references, is provided by Laurent Longre, and uses the CALL function to access the Excel4 macro function library.   Click here for details.


Left Lookups

The easiest way do table lookups is with the =VLOOKUP function.   However, =VLOOKUP requires
that the value returned be to the right of the value you're looking up.  For example, if you're
looking up a value in column B, you cannot retrieve values in column A.  If you need to
retrieve a value in a column to the left of the column containing the lookup value, use
either of the following formulas:
=INDIRECT(ADDRESS(ROW(Rng)+MATCH(C1,Rng,0)-1,COLUMN(Rng)-ColsToLeft)) Or
=INDIRECT(ADDRESS(ROW(Rng)+MATCH(C1,Rng,0)-1,COLUMN(A:A) ))
Where Rng is the range containing the lookup values, and ColsToLeft is the number of columns
to the left of Rng that the retrieval values are.  In the second syntax, replace "A:A" with the
column containing the retrieval data.  In both examples,  C1 is the value you want to look up.
See the Lookups page for many more examples of lookup formulas.


Minimum And Maximum Values In A Range

Of course you can use the =MIN and =MAX functions to return the minimum and maximum
values of a range. Suppose we've got a range of numeric values called NumRange.
NumRange may contain duplicate values.  The formulas below use the following example:
Max1
Address Of First Minimum In A Range
To return the address of the cell containing the first (or only) instance of the minimum of a list,
use the following array formula:

=ADDRESS(MIN(IF(NumRange=MIN(NumRange),ROW(NumRange))),COLUMN(NumRange),4)
This function returns B2, the address of the first '1' in the range.

Address Of The Last Minimum In A Range
To return the address of the cell containing the last (or only) instance of the minimum of a list,
use the following array formula:

=ADDRESS(MAX(IF(NumRange=MIN(NumRange),ROW(NumRange)*(NumRange<>""))),
COLUMN(NumRange),4)
This function returns B4, the address of the last '1' in the range.

Address Of First Maximum In A Range
To return the address of the cell containing the first instance of the maximum of a list,
use the following array formula:

=ADDRESS(MIN(IF(NumRange=MAX(NumRange),ROW(NumRange))),COLUMN(NumRange),4)
This function returns B1, the address of the first '5' in the range.

Address Of The Last Maximum In A Range
To return the address of the cell containing the last instance of the maximum of a list,
use the following array formula:

=ADDRESS(MAX(IF(NumRange=MAX(NumRange),ROW(NumRange)*(NumRange<>""))),
COLUMN(NumRange),4)
This function returns B5, the address of the last '5' in the range.
Download a workbook illustrating these formulas.


Most Common String In A Range

The following array formula will return the most frequently used entry in a range:

=INDEX(Rng,MATCH(MAX(COUNTIF(Rng,Rng)),COUNTIF(Rng,Rng),0))
Where Rng is the range containing the data.


Ranking Numbers

Often, it is useful to be able to return the N highest or lowest values from a range of data.
Suppose we have a range of numeric data called RankRng.   Create a range next to
RankRng (starting in the same row, with the same number of rows) called TopRng.
Also, create a named cell called TopN, and enter into it the number of values you want to
return (e.g., 5 for the top 5 values in RankRng). Enter the following formula in the first cell in
TopRng, and use Fill Down to fill out the range: 
=IF(ROW()-ROW(TopRng)+1>TopN,"",LARGE(RankRng,ROW()-ROW(TopRng)+1))
To return the TopN smallest values of RankRng, use

=IF(ROW()-ROW(TopRng)+1>TopN,"",SMALL(RankRng,ROW()-ROW(TopRng)+1))
The list of numbers returned by these functions will automatically change as you change the
contents of RankRng or TopN.
Download a workbook illustrating these formulas.
See the Ranking page for much more information about ranking numbers in Excel.


Removing Blank Cells In A Range

The procedures for creating a new list consisting of only those entries in another list, excluding
blank cells, are described in 
NoBlanks.

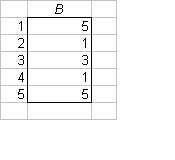
Summing Every Nth Value

You can easily sum (or average) every Nth cell in a column range. For example, suppose you want to sum every 3rd cell. 

If you want to sum the values in rows 3, 6, 9, etc, use the following array formula:
=SUM(IF(MOD(ROW($B$3:$B$22)-ROW($B$3),$D$1)=0,$B$3:B$22,0))
Download a workbook illustrating these formulas.


Miscellaneous
Sheet Name
Suppose our active sheet is named "MySheet" in the file C:\Files\MyBook.Xls.
To return the full sheet name (including the file path) to a cell, use

=CELL("filename",A1)
Note that the argument to the =CELL function is the word "filename" in quotes, not your
actual filename.
This will return "C:\Files\[MyBook.xls]MySheet"
To return the sheet name, without the path, use

=MID(CELL("filename",A1),FIND("]",CELL("filename",A1))+1,
LEN(CELL("filename",A1))-FIND("]",CELL("filename",A1)))
This will return "MySheet"

File Name
Suppose our active sheet is named "MySheet" in the file C:\Files\MyBook.Xls.
To return the file name without the path, use

=MID(CELL("filename",A1),FIND("[",CELL("filename",A1))+1,FIND("]",
CELL("filename",A1))-FIND("[",CELL("filename",A1))-1)
This will return "MyBook.xls"
To return the file name with the path, use either

=LEFT(CELL("filename",A1),FIND("]",CELL("filename",A1))) Or

=SUBSTITUTE(SUBSTITUTE(LEFT(CELL("filename",A1),FIND("]",
CELL("filename",A1))),"[",""),"]","")
The first syntax will return "C:\Files\[MyBook.xls]"
The second syntax will return "C:\Files\MyBook.xls"
In all of the examples above, the A1 argument to the =CELL function forces Excel to get the sheet name from the sheet containing the formula.   Without it, and Excel calculates the =CELL function when another sheet is active, the cell would contain the name of the active sheet, not the sheet actually containing the formula.
Download a workbook illustrating these formulas.

Suppose your data is in A1:A20, and N = 3 is in D1.  The following array formula will sum the values in A3, A6, A9, etc.
=SUM(IF(MOD(ROW($A$1:$A$20),$D$1)=0,$A$1:$A$20,0))
If you want to sum the values in A1, A4, A7, etc., use the following array formula:
=SUM(IF(MOD(ROW($A$1:$A$20)-1,$D$1)=0,$A$1:$A$20,0))
If your data ranges does not begin in row 1, the formulas are slightly more complicated. Suppose our data is in B3:B22, and N = 3 is in D1.   To sum the values in rows 5, 8, 11, etc, use the following array formula:
=SUM(IF(MOD(ROW($B$3:$B$22)-ROW($B$3)+1,$D$1)=0,$B$3:B$22,0))


To return the last name, use
=RIGHT(A2,LEN(A2)-FIND("*",SUBSTITUTE(A2," ","*",LEN(A2)-
LEN(SUBSTITUTE(A2," ","")))))
To return the first name, including the middle name (if present), use
=LEFT(A2,FIND("*",SUBSTITUTE(A2," ","*",LEN(A2)-
LEN(SUBSTITUTE(A2," ",""))))-1)
To return the first name, without the middle name (if present), use
=LEFT(B2,FIND(" ",B2,1))


Feb 3, 2012

How to Document SQL Server- BI Documenter


So you created this amazing BI solution. You have SSIS Packages loading your data warehouse, you have SSAS Cubes, and you have reports in SSRS.  But how do you document this entire solution? It used to be a long tedious process. Now it’s easy!

Bi Doucmenter

Bi Documenter is a must have tool for anyone using SQL Server. It will document SSIS, SSAS, SSRS, and databases. BI Documenter will create either HTML files, or one CHM file containing all of the information of your environment.
Bi Doucmenter


Every wonder where a column on a report is pulled from, but don’t want to drill down through a cube, to a data warehouse, through an SSIS package finally to arrive at the desired table? Bi Documenter makes that easy too, with the impact and linage tool. It will graphically show you where every bit of data is going to and coming from. Simply use the graphical interface and click on each item to follow your entire BI solution.

Bi Doucmenter